Customers
- Who uses your products or services?
- Who pays for them?
- Who has complained about you?
- Who loves what you do?
Facilitation method
A bird’s-eye view of the interconnected world inside and around your business, drawn by the people who work in it.
You are here
Map key
Ecosystem mapping is a facilitated, visual way for a group to see every team, partner, and customer in its system, and how they relate to each other.
Ask any team how it improved this year and you will hear great answers. But improving one team in isolation often just shifts the problem somewhere else in the system. A lot of the opportunity sits in the space between teams.
An ecosystem map makes that space visible: who works with whom, what value moves between them, and where the relationships are strong, forming, or in conflict. Then when you make a change, you improve the whole system, not just one part of it.
How the map is made
“This circle represents your relationship ecosystem. To succeed, it needs to be healthy.”
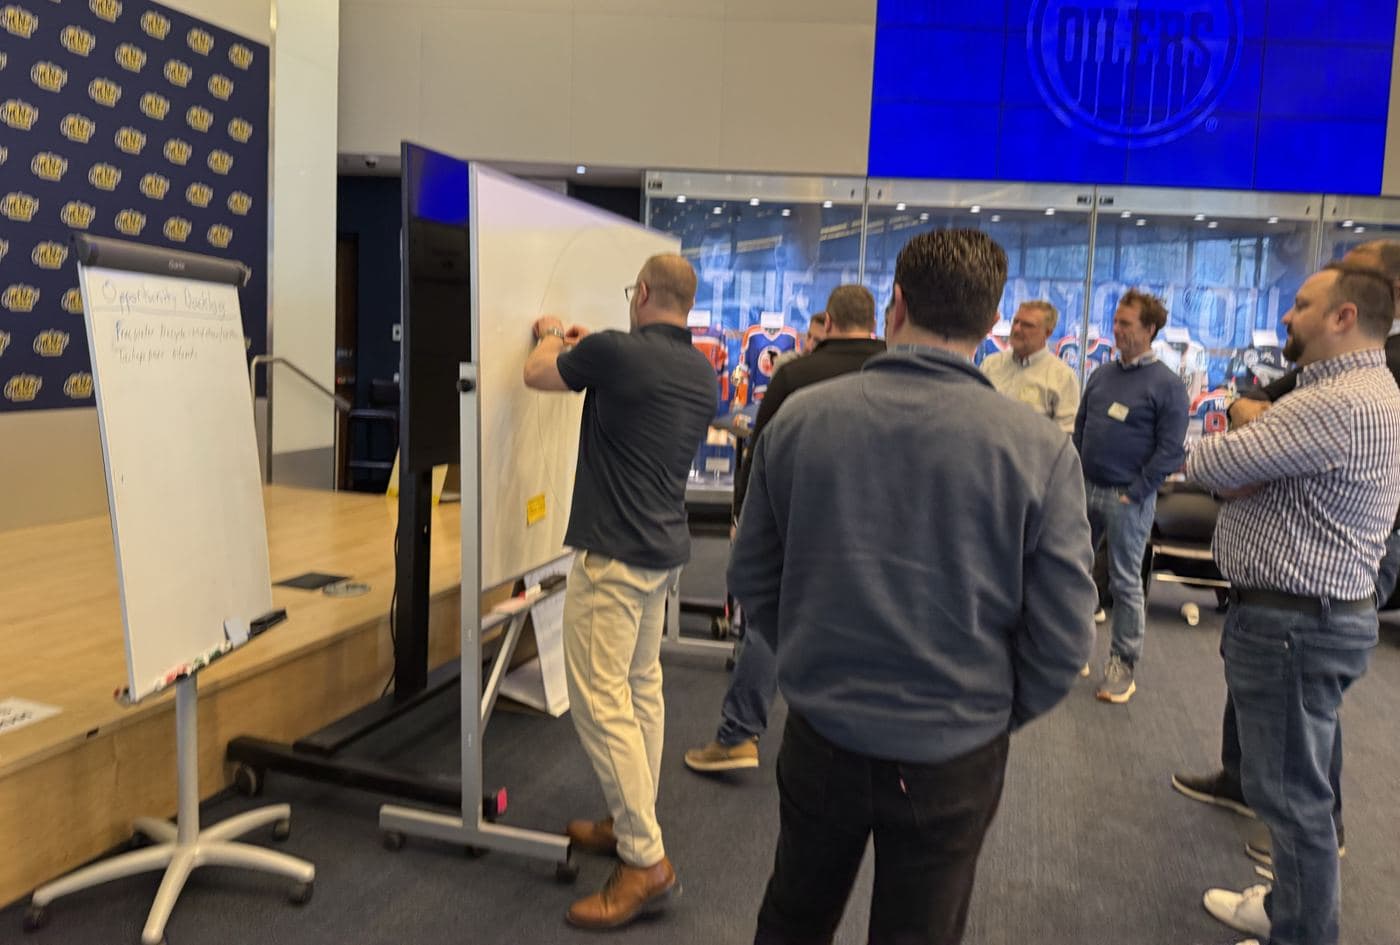
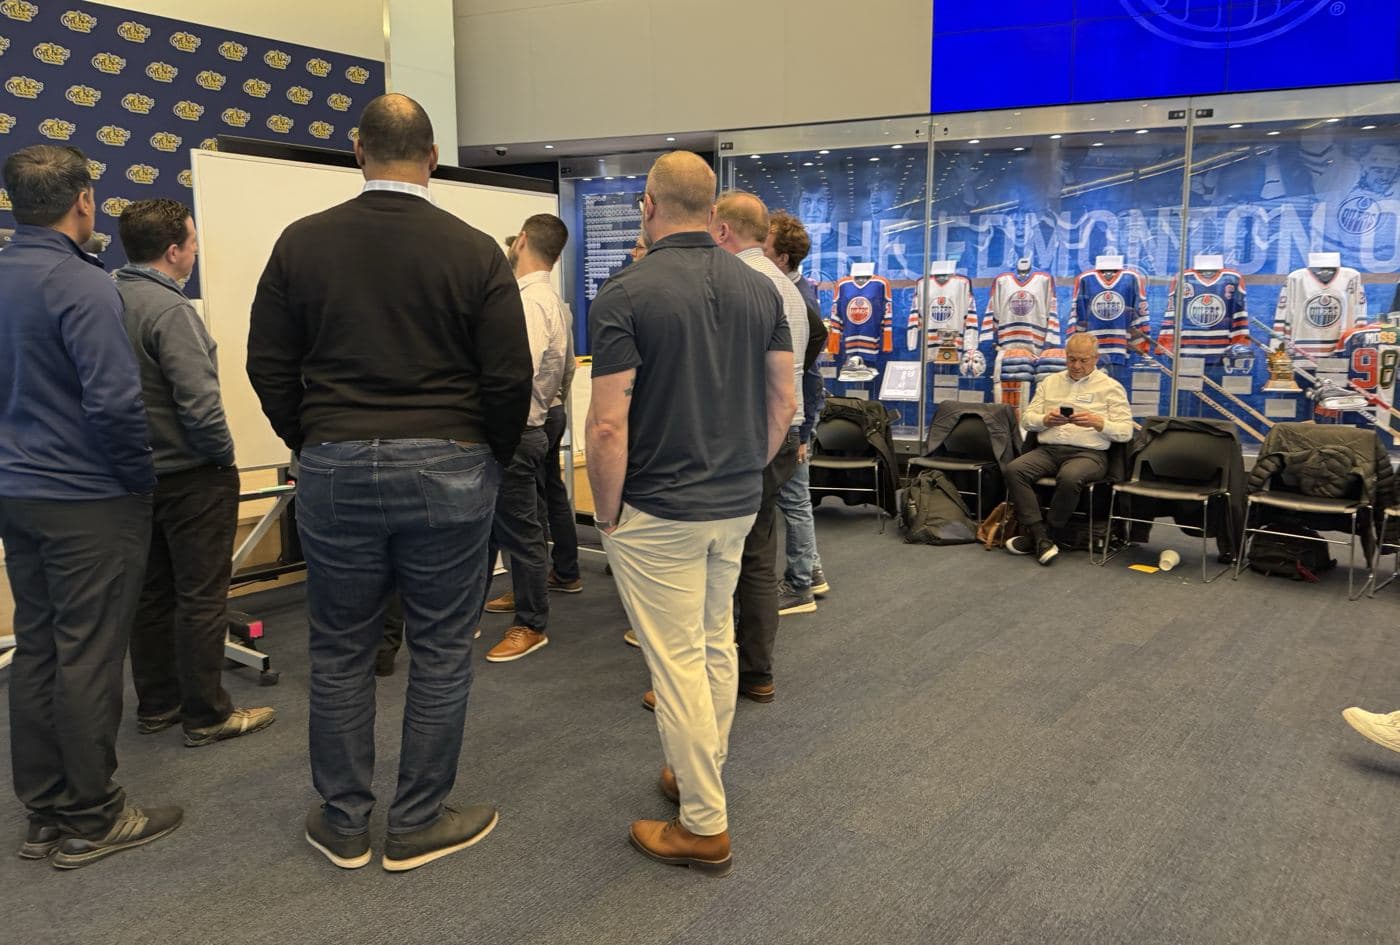
One person from each team puts its name on the map and moves it until it feels right. Two rules: no talking, and everyone makes at least one move. Who is at the heart? Who sits close, and who is far away?
Customers, regulators, suppliers, competitors, partners, and the goals and major events that shape the year all go on the map too.
In breakouts, each team draws a line to every entity it works with: forming, average, strong, or in conflict.
Sticky notes on each line show the value exchanged, like money, services, or information, and the top roadblocks to working together.
Each team redraws its part of the map the way it would like it to be in a year, then presents it to the room.
Legend
Every relationship on the map gets one of four lines. Teams agree which one fits, out loud.
Dotted. A relationship that is new, occasional, or still finding its shape.
Solid. Steady and working, without much to celebrate or worry about.
Double. Trust, frequent contact, and value moving both ways.
Jagged. Friction, competing goals, or a history the group needs to talk about.
The top things getting in the way of working together, written on the line where they happen.
The edge of the map
The people who aren’t in the room still shape the system. Before anyone draws a line, we ask who else belongs on the map.
Field notes
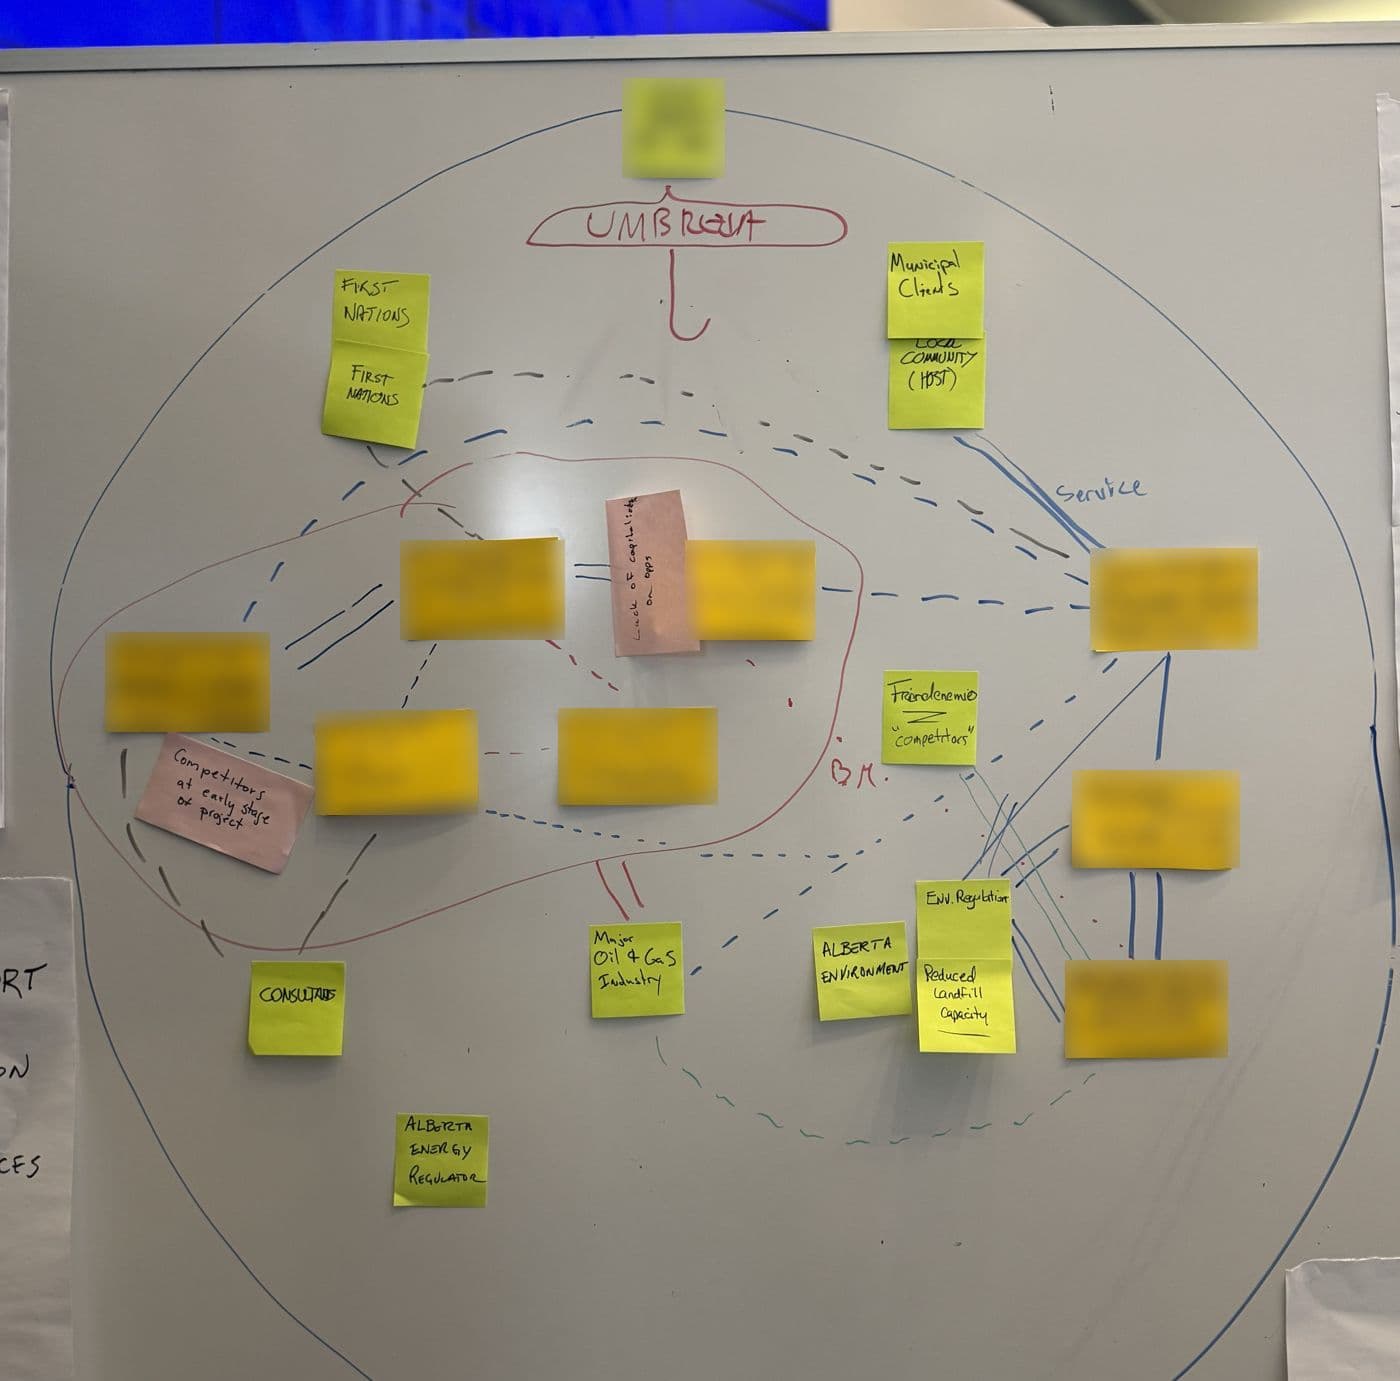
The edge of the relationship ecosystem the group agreed to look at.
Relationships still forming, often between business lines that rarely work together.
The strongest relationships on the map.
Roadblocks to collaboration, written straight onto the map.
Regulators, communities, and industry players who were not in the room but shape the work.
The last layer
An illustrative example. Each team draws its own.
Where the map led
Business development professionals from four business lines at a national environmental services provider spent the first half of the day mapping their shared ecosystem: municipal services, industrial water treatment, chemicals, and hazardous waste. The map surfaced overlapping mandates, gaps, and places to connect. In the afternoon, those opportunities became the topics for Open Space.
Read the case studyCheck the terrain
A facilitated ecosystem map records the group’s current view of its system. It can leave people out, reflect who holds power in the room, or mix perception with fact. That’s why we treat it as a starting point for better questions. Material technical, financial, legal, clinical, safety, environmental, or Indigenous-rights decisions need the relevant evidence and qualified authorities, beyond the workshop map.
Sample agenda
A full day that pairs ecosystem mapping with Open Space. We shape the stops, timing, and breaks with you.
Folded up and taken home
Photographed and written up, so it lives on after the whiteboard is wiped.
Forming, average, strong, conflict. Four words teams keep using long after the day.
What each relationship gives and gets, and what is getting in the way.
How each team wants its corner of the system to look by next year.
The gaps and overlaps worth a conversation, ready to become next steps.
Next destinations
A map shows you where the opportunities are. These methods help the group act on them.
The mapping itself takes about two hours, including time for every team to present. We often pair it with Open Space in the afternoon, so the opportunities on the map turn into conversations and next steps the same day.
At least one person from every team or business line that touches the outcome. People who can’t attend still go on the map: customers, regulators, partners, and anyone else the system depends on.
An org chart shows who reports to whom. A stakeholder map usually puts one organization in the middle. An ecosystem map shows how everyone relates to everyone else, what value moves between them, and where the relationships are strong, forming, or in conflict.
It comes from Organization and Relationship Systems Coaching (ORSC), a toolkit for improving how relationships work across a system. Our facilitators hold the ORSCC credential.
We photograph it and include it in a summary report. The most useful next step is to pick a few relationships or roadblocks to work on, give each one an owner, and look at the map again once you have new evidence.
Tell us which teams, partners, and customers make up your system. We’ll help you design the session and decide what the map should help the group act on.
Book a discovery call